BOM - Solar and GEOH5
Several years ago (back in 2021), I came across the daily solar exposure data shared by Australia’s Bureau of Meteorology (BOM). This weekend I revisited using the data to convert it into the GEOH5 format, an open format for geo-science data.
Data
The data itself is stored as a Arc/Info (Esri) grids as ASCII in row-major order. There is a grid produced for each day, the resolution for spatial data is 0.05 degrees or about 5km.
The file format itself is documented on the Wikipedia article for Esri grid. I had already written the code to read the format back in 2021 which I reused for this project.
GEOH5
- Aims to provide a format suitable for geoscience
- Based off HDF5 - that is to say it uses that format for dealing with the arrangeable of bytes on disk as well as providing a higher-level way of grouping the data together.
- It became the main format behind Mira Geoscience’s Geoscience ANALYST product.
- The reference implementation provided by geoh5py.
My thought on the format is the reliance on HDF5 means you need to understand that format for decisions in GEOH5 to make sense as understand the basics of how the data is structured. The second is the entities / types themselves are not documented within the format such as the points, 2D grid and surface types. Perhaps, those types are considered application specific which means its less a format for geoscience but the building blocks for those types.
Next comes to the reference implementation, geoh5py. This avoids the need to know about HDF5 itself which is good if you can use it to read/write it today. The choice of LGPL for geoh5py does seem odd given that it is Python. The licence is built around the idea of shared library and linking. This doesn’t fit the model of pure-Python as it doesn’t really relate to those unless you consider importing as being loading/linking against hte shared library (i.e. Python package or module). My guess would be the thinking behind the choice was to ensure modifications to the package would need to be provided back.
The other thing I’ve observed is some behaviour is not documented such as the colouring objects seem to be stored in an undocumented XML document.
Combining the two
The API from geoh5py package isn’t difficult to start off with but there are
some non-obvious things it does that tutorial could do to cover. A problem I ran
into was how to add an entity to a group. The tutorial doesn’t cover it (except
in the context of drillholes and drillholes groups that I overlooked at the
time). Looking at the API reference I expected it to be
group.add_children(grid) but it turned out when you create the entity you
must pass parent=group, to the create() function. I’ve provided this
as feedback to them so hopefully that can be improved. Update 2025-01-25:
add_children() works correct with 0.10.0 released yesterday.
The other gotcha was adding the data as the Grid2D.create() creates
the basic topology and geometry of the grid but doesn’t handle associating the
data and the tutorial doesn’t continue on with tell you “next you can add data
to it” and linking to how. This is where you need to jump across “Float data”
section in the tutorial which covered add floating point data to an object
entity. This is general so it applies to every object type I think.
Orientation
Importing in a shapefile containing the Coastline from Natural Earth, made it a easy to diagnose the problem with the orientation of the data.
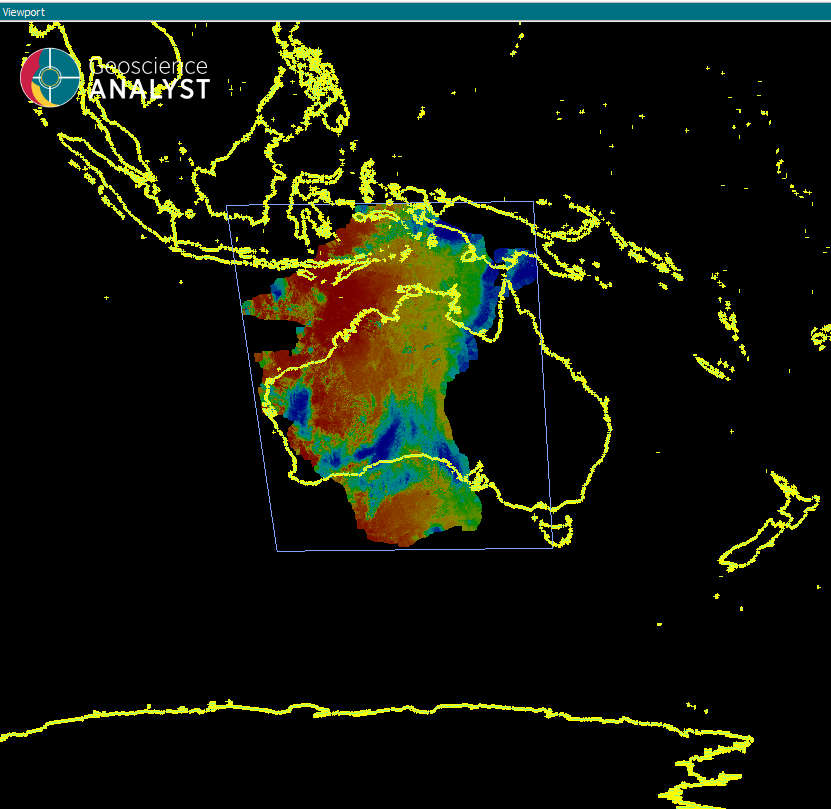
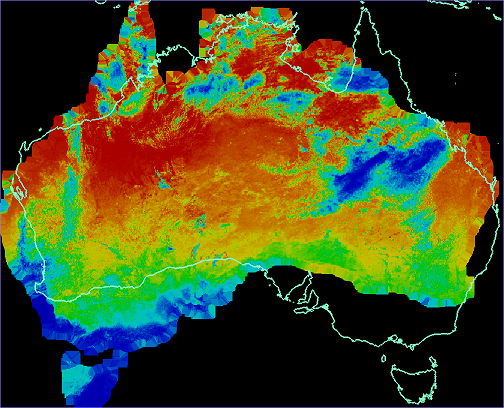
In this case it was a manner of fixing swapping around the row/columns (u and v counts in geoh5py terms). However, that still left me with the data not fitting in Australia as solar data was upside down and around the wrong way.
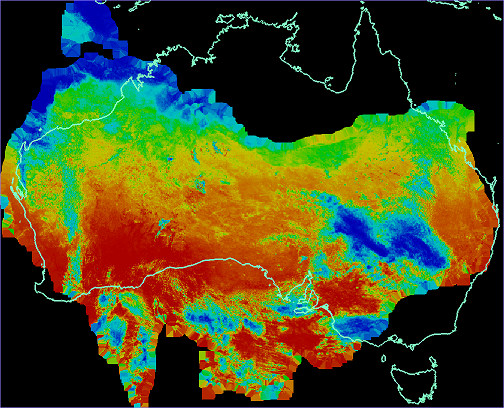
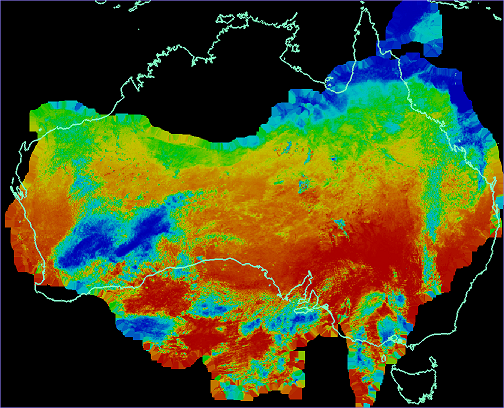
To sort it out I modified my code to add the four different permutations of the data with various flipping applied, which made it easy to figure out what I needed to do. It was a matter of switching between the data in Geoscience ANALYST to find the one that was correct.
The code essentially looked looked like this:
    for u, v in itertools.product([-1, 1], [-1, 1]):
        grid.add_data(
            {
                f"Solar {u},{v}": {
                    "association": "CELL",
                    "values": data.to_numpy()[::u, ::v].ravel(),
                },
            },
        )
The result is I had the other three cases.

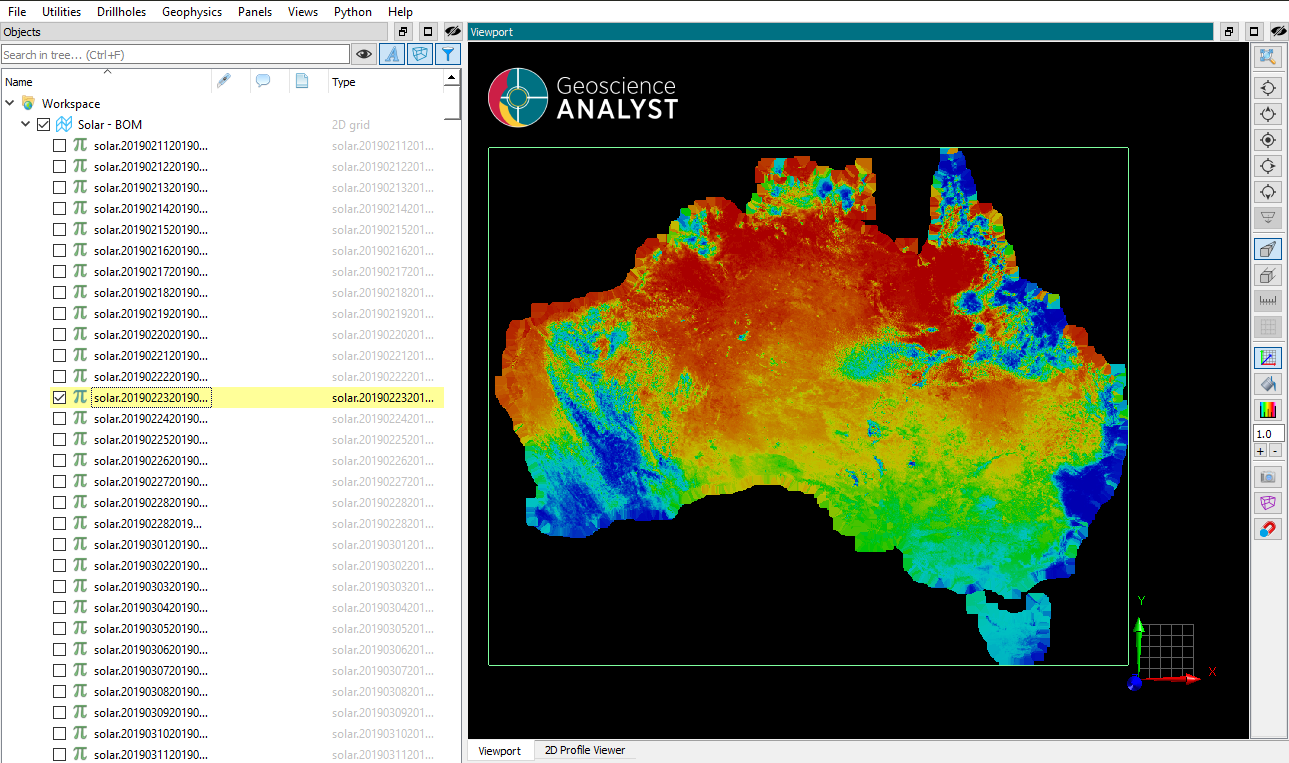
New mode
The original plan was to create a single grid for each file, however this is rather a pain to use within Geoscience ANALYST. Since all the grids are at the same position, grid size and shape it is possible to make a single grid with each file a “data” for that grid.
Future
Look at creating a colour table in the workspace that matches the colour schema used by the BOM on their website.
Source
- bom.py - Module for reading the Esri Grid and dealing with the tarball and compressed data.
- bom_solar_geoh5 - Module which brings bom.py and geoh5py together to make a GEOH5 workspace with the daily solar data.