OSM to Raster Tiles
This post has been a long time coming. It started out being an attempt to document a project that was mostly done 2020-09-12. Various notes were collected from that time but I wanted to re-create it to try to fill in some missing steps and inaccuracies.
After a few false starts this year, I have finally managed to recreate part of that project. This is therefore documents the most recent effort which was a success even if it deviated with how it done the first time.
The original project was to produce a Tagged Image File Format (TIFF) from the Portable Network Graphics (PNG) tiles generated from the Open Street Map data. That stage will be the topic of a subsequent post.
Open Street Map Data
The first place to start is downloading an extract of the OpenStreetMap data. A great place to do this is from Geofabrik as they provide data by region as well as sub-regions so you get get a smaller part of the world.
In my case I was interested in Australia so I used that below however previously I used the Australia and Oceania which is a larger area and covers extra territories.
Map Styling
CartoCSS is a system for defining style-sheet for maps and the carto tool can
convert from the MML format to Mapnik XML.
The style-sheets describe how things should look (colour, line thickness, patterns) as well as when they are applicable, such as what zoom-level the feature appears on.
For this article I used the OSM Carto style.
OSM Carto
The CartoCSS format stylesheets for OpenStreetMap style is found in the openstreetmap-carto repository by gravitystorm. It is unclear why ownership was not transferred to the openstreetmap organisation as such they don’t look as official as the old Mapnik styles.
- Install carto through npm.
- Clone the Git repository for the OSM CartoCSS style.
git clone https://github.com/gravitystorm/openstreetmap-carto.git - Check out version tag, when writing this up it was
v5.6.1. - Edit project.mml with the postgres information such as different host, port or user if you need to.
- Run Carto to convert from the MML format to Mapnik XML.
carto project.mml --file osm-mapnik.xml
Database Setup - Linux
This time around Linux was used instead of Windows to host the database. This was mostly because I tried using the Ubuntu packages and had trouble setting it up so Ubuntu could access the PostgreSQL Server on my Windows machine.
Ubuntu was running under Windows Subsystem for Linux (WSL). I didn’t want to load the data into the default instance as I wanted to have it all in its own data directory and ran into problems. The problems were with permission for the directory on Window and the solution I decided to go with was to create a Virtual Hard Drive and mount it into VM.
- Set-up and mount virtual hardrive.
This step was needed due to WSL and my insistence on not dumping it into the
normal system volume of the Linux distribution.
For reference see the GitHub discussion about it
- Create a 30GB VHDX - the size was based on last time I knew it took about 22GB. I regrettably did this using the Disk Manager graphical user application rather than with the PowerShell command-let so it not simply a matter of stating the command.
- The disk was initialised as GPT rather than MBR or leaving it empty however from what I understand of the warnings I got later this step wasn’t needed.
- Mount the virtual hard drive to WSL.
wsl --mount --vhd D:\vms\VirtualHardDisks\osm_postres.vhdx --bare - From WSL Distribution
dmesg # dmesg will include a line stating what device the virutal drive was mounted # at. In my case that was sde. mkfs -t ext4 -i 12000 /dev/sde - From Windows, unmount it.
I’m not sure if its possible to try to umount/detach the drive from
within the WSL Distribution.
wsl --unmount --vhd D:\vms\VirtualHardDisks\osm_postres.vhdx - Re-mount the drive. This step is repeated whenevery I want to re-mount it.
It is possible to configure WSL to auto-mount it.
wsl --mount --vhd D:\vms\VirtualHardDisks\osm_postres.vhdx --name osm_postgres
- Setup the postgres database.
sudo apt install postgresql postgis osm2pgsql sudo mkdir /mnt/wsl/osm_postgres/osm_psqldb sudo chown postgres:postgres /mnt/wsl/osm_postgres/osm_psqldb sudo --login --user postgres /usr/lib/postgresql/14/bin/initdb --username=postgres --auth=trust --encoding=utf-8 /mnt/wsl/osm_postgres/osm_psqldb # Modify the postgres.conf in the data folder with a different port (I used 15000) /usr/lib/postgresql/14/bin/pg_ctl -D /mnt/wsl/osm_postgres/osm_psqldb -l /mnt/wsl/osm_postgres/osm_psqldb/logfile start /usr/lib/postgresql/14/bin/createdb --port 15000 -U postgres gis /usr/lib/postgresql/14/bin/psql --port=15000 --username=postgres -d gis -c 'CREATE EXTENSION postgis; CREATE EXTENSION hstore;' - Import the data
osm2pgsql --port=15000 --username=postgres --database gis --create --slim -k /opt/australia-latest.osm.pbf
osm2pgsql --port=15000 --username=postgres --database gis --slim -C 3600 --hstore -S openstreetmap-carto/openstreetmap-carto.style --tag-transform-script openstreetmap-carto/openstreetmap-carto.lua /opt/australia-latest.osm.pbf
First command: osm2pgsql took 2087s (34m 47s) overall. Second command: osm2pgsql took 1643s (27m 23s) overall.
This next command requires ogr2ogr (from gdal-bin)
openstreetmap-carto$ scripts/get-external-data.py --port 15000 --user postgres --database gis
Rendering tiles
At this point, I tried running the generate_tiles.py script which I had used previously, but that resulted in this error:
RuntimeError: projection::forward not supported without proj4 support (-DMAPNIK_USE_PROJ4)
After a few hours, of mucking about and attempting to rebuild the mapnik and python bindings for mapnik, I eventually gave up on that. A new plan was born to eliminate the Python side and use the C++ API for libmapnik.
It turned out quite easy to re-write the generate_tiles.py in C++ and given I knew the destination map was web mercator (EPSG: 3857), I didn’t need as much conversion code as before.
New program
- Use
boost::program_optionsto handle the command line options.- map-file - the map file in Mapnik XML. This is typically generated from a MML document (a stylesheet for a map) with CartoCSS
- output - the directory to output tiles into.
- fonts - the directory to fonts needed by the map style. This is to handle if it can’t otherwise find the fonts.
- Setup mapnik - this is needed to register the image handlers so it can read PNG files (used in the style-sheet)
- Register the data sources (plugins) so it can find the postgis plugin which is needed for talking to PostgresSQL.
- Register the fonts folder if the argument is provided.
- Load the map file
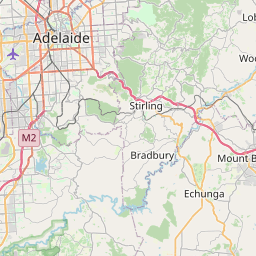
- Zoom to the extent of interest. In my case this was around the city of Adelaide where I live.
- Render the map to an image and save it to a file.
This produced this overview image which confirmed everything was working:

Next was rendering a single tile given its tile index (or tile coordinates), so X, Y and zoom where X and Y are the tile indices not Cartesian coordinates or WGS84 (latitude and longitude).
The tile to render first was zoom level 10, x of 906 and y of 618. That tile can be seen on OpenStreetMap.
The three images are all of this tile
- The first is the original render I did back in 2020
- The second is the new render I did in July 2023.
- The third is a visualisation of the difference between the two.


Interestingly both differ from the current rendering on OpenStreetMap, The new render is closer (the classification of a road changed so it is now yellow) but the label of one the region on the right is “Little…” on mine but “Mount …” on both OpenStreetMap at the time of writing and the old render.
Next up was rendering the tiles.
- For each zoom level in the range of zooms to take (in my case 4 to 17).
- Determine the slippy map bounds (or tile indices) for the region of interest for the given zoom level.
- For each tile within the bound for that level, render that tile to a PNG.
In my implementation it actually does two steps here, the first is creating directories for all the files and then creating the tiles with the intention begin the first pass will be single threaded but the tile rendering will be multi-threaded.
The hurdle I ran into with this was I accidentals lost pi in one of the formulas for calculating the x tile index from WGS-84 coordinates.
Running it:
# Linux
./a.out --map-file ~/openstreetmap-carto/osm_carto_linux.xml
The result of letting it run is eventually end up with PNGs (rasters) of the tiles.

The source code this program is available on GitHub.
Conversions
WGS84 to Web Mercator
I defined the bounding box I was interest in in EPSG 4326 more commonly known
as WGS 84. The maptnik::Map class pans/zooms to a region based
on coordinates in its projection which for OpenStreetMap data is EPSG 3857
known as web mercator.
There wer etwo options here:
- Use
mapnik.ProjTransform()to transform coordinates between the two coordinate reference systems. - Use
mapnik::lonlat2merc()which handles that single transform.
In my implementation I went for this second option.
Slippy to WGS 84
As mentioned a conversion needed was to go from slippy map to WGS84, as this this enables given the slippy map indices. For example from zoom 10, tile x of 906 and tile y of 906 to the WGS84 coordinates.
This was needed because the maptnik::Map class pans/zooms to a region based
on coordinates in its projection. In practice this means web mercator (EPSG
3857), however the documentation covers going from the slippy map scheme
to WGS84 (latitude and longitude) rather than straight to web mercator.
mapnik::coord2i wgs84_to_slippy(mapnik::coord2d wgs84, int zoom)
{
    double lat_rad = wgs84.y * mapnik::util::pi / 180.0;
    return {
        (int)(floor((wgs84.x + 180.0) / 360.0 * (1 << zoom))),
        (int)(floor((1.0 - asinh(tan(lat_rad)) / mapnik::util::pi) / 2.0 *
                    (1 << zoom)))};
}

mapnik::coord2d slippy_to_wgs84_corner(int x, int y, int zoom)
{
    const double n =
        mapnik::util::pi - mapnik::util::tau * y / (double)(1 << zoom);
    return {
        x / (double)(1 << zoom) * 360.0 - 180,
        180.0 / mapnik::util::pi * atan(0.5 * (exp(n) - exp(-n)))
    };
}
Bonus
Using vcpkg to build mapnik, I was able to build and run the tool on Windows. The only minor problem I ran into there was the PDBs for the plugins are not kept so you can’t debug them. This was problematic as I initially had issues with it connecting to the postgres database.
Next
- Combine the generated PNGs into a TIFF.
- Explore the vector tiles rather than rasters seen here.