Drawing Routes via Open Source Routing Machine
Last time, I documented my process set-up the use of the Open Source Routing Machine (OSRM). That left me with the routing demon that returned returning routes between two points.
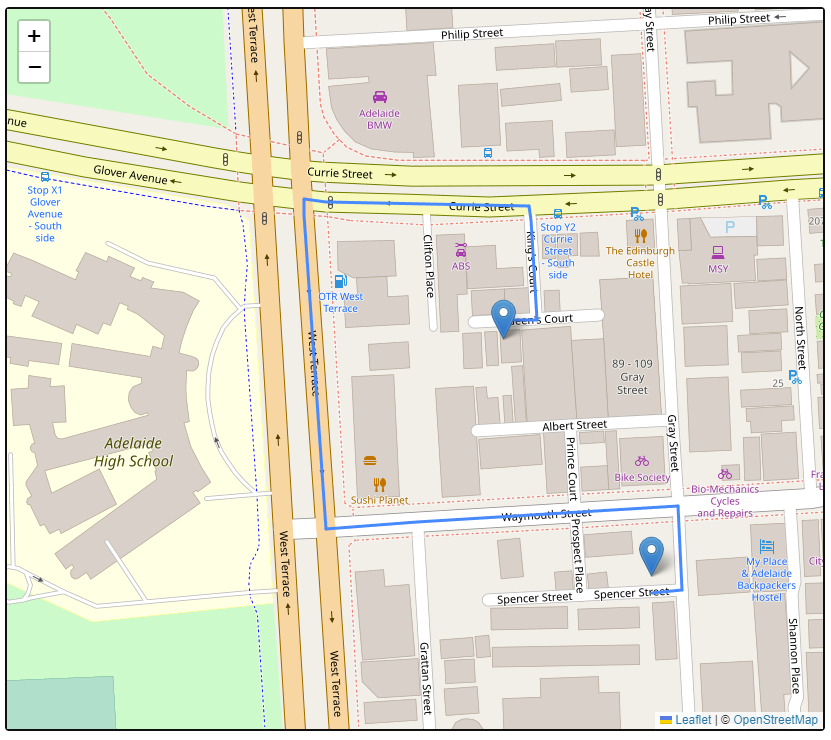
Today, I will be looking at visualising the route given. I started off using the simple web page with Leaflet embedded on it that I had set-up previously to show markers at the start and end point. So the goal today was take the route information and convert it to polylines that I could draw on the map.
The API call from last time returns a result object. This result object (Result) has legs (RouteLeg) which contains the steps (RouteStep) and these steps have the geometry (polyline) .The geometry field uses Google’s polyline format (with precision 5 rather than 6) however the request can be altered to give it in precision 6 or as a GeoJSON LineString instead.
I believe because I am only working with two points that there will only ever be a single leg in the returned route.
For decoding the polyline, I used one of two libraries:
- polyline.js from Mapbox for decoding it client side.
- polyline on PyPI for decoding it directly in Python.
The resulting code snippet is as follows
def print_leaflet_code(pickup, dropoff, route):
    print("var pickup = L.marker([{}, {}]).addTo(map);".format(
            pickup['latitude'], pickup['longitude']))
    print("var dropoff = L.marker([{}, {}]).addTo(map);".format(
            dropoff['latitude'], dropoff['longitude']))

    if len(route['legs']) > 1:
        raise NotImplementedError('More than one leg')

    leg = route['legs'][0]
    for number, step in enumerate(leg['steps']):
        print("var step%d = L.polyline(polyline.decode(\"%s\")).addTo(map)" %
              (number, step['geometry']))
From there I add it to the web page.
Folium
A Python package I came across was folium, this essentially provides an out-of-box solution for producing HTML pages with a map, markers and polyline from Python without having to write the HTML code. This package really shines when used with a JupyterLab notebook.
I have plans for this work more than just quick visualizations so the effort I put in into learning interacting with Leaflet.js is not wasted. It needs to be mentioned that the API for folium is incredible close to Leaflet.js so very much allows you to port any of the Python code to JavaScript and be ready-to-go as the API match.
New York City Taxis
In addition to the preparing the OSRM data for Australia, I prepared the data for the US North East.
The goal here was to take the pick-up and drop-off locations of taxis reported to a taxi and limousine commission in 2015-01-06 and plot a potential route it took for each. I say potential because the routing information lacks any time-aware information such as road closures or high traffic at that time.
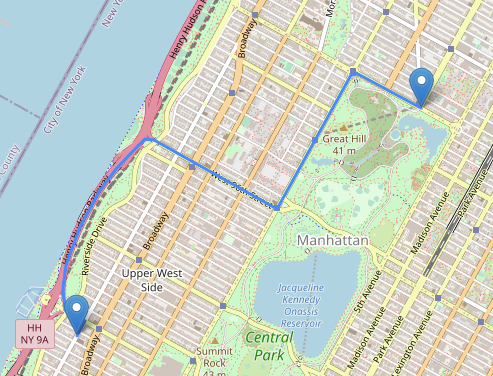
The above shows the first trip that I ran through the routing plotted on a map provided by OpenStreetMap of New York City.
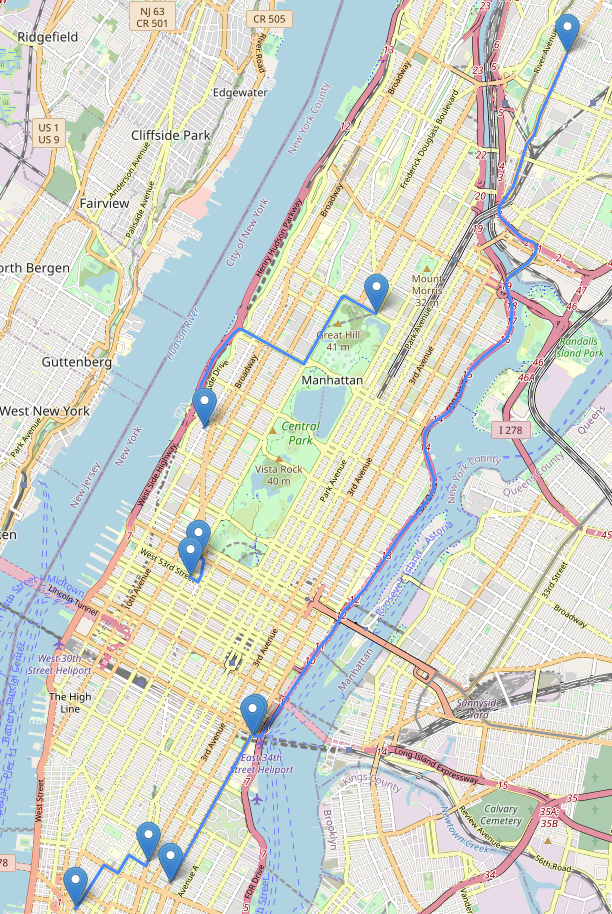
Above is the map showing five trips, I had plotted ten but chose the ones with the most trips in frame.
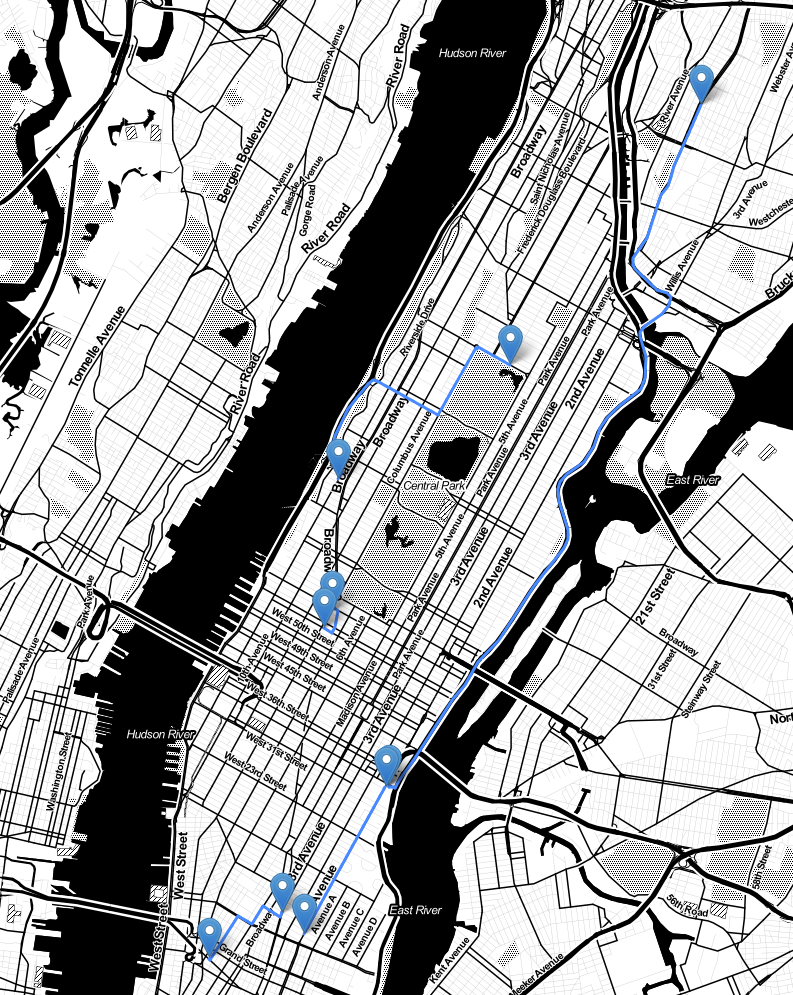 The final image was exploring a different map style/provider (Stamen Toner)
that was available via folium.
The final image was exploring a different map style/provider (Stamen Toner)
that was available via folium.
Python and Async
I started off only working with 10 trips/routes, however when I removed the limit to start doing 50 it started taking a large amount, this came down to doing one request after the other.
I used this opportunity to dip my toe into learning about Python’s asynchronous programming model. I used aiohttp for the HTTP request and asyncio for the event loop. I was surprised how big a different this made. It went from taking 103 seconds to 4 seconds for 50 queries.
The approach I took was to set-up the route queries to run asynchronously then gather the results before adding that to folium.
    # frame is the Python dataframe with the CSV information containing the
    # start and end pairs.

    loop = asyncio.get_event_loop()
    routes = loop.run_until_complete(fetch_routes(frame))

    for route in routes:
        leg = route['legs'][0]
        for step in leg['steps']:
            folium.PolyLine(polyline.decode(step['geometry'])).add_to(m)
I did consider tweaking this slightly so the async function also pulled apart the JSON so it returned a list of polyines for each route. However, I didn’t pursue that in case I want to explorer pulling out more data than only the geometry.
Future
- Produces the navigation system-like text of the form.