Reading data from MERRA-2
MERRA-2 is Modern Era Retrospective-analysis for Research and Applications which is a dataset produced by NASA. The 2 signifies the second version or generation after the first program was decommissioned due to ageing equipment.
The data itself is using Goddard Earth Observing System Data Assimilation System Version 5 (GEOS-5).
This data was interesting because it provides 3-dimensional data and over time as well.
The README Document for MERRA-2 Data Products lists the various products, where products in NASA speak for prepared datasets that you can download. It provides a breakdown into categories, listed below, each product provided and what fields/attributes the product contains.
For a high-level look at what categories the data falls into, they are:
- Instantaneous Two-Dimensional Collections
- Instantaneous Three-Dimensional Collections
- Time Averaged Two-Dimensional Collections
- Time Averaged Three-Dimensional Collections
The dataset I was interested in visualising was the Aerosol Mixing Ratio which is in the Instantaneous Three-Dimensional category. The data set contains information about the air density and amounts of sulphur dioxide, sulphate aerosol, methanesulphonic acid and dimethylsulphide.
Data format - NetCDF 4
The data is provided in NetCDF 4 format. The format is intended to be good for interchange between multiple machines as it is a machine-independent data format.
The goals/features of NetCDF are:
- Self-describing - The file itself contains data that describes more about the format.
- Portable - Also known as machine-independent as the data can work on different types of machines.
- Scalable - Subsets of large data can be accessed even through remote servers.
- Appendable - Data can be added to it without needing to write out everything else again.
- Shareable - One writer and multiple reader may access the same file
- Archivable - Earlier versions of the format should remain readable in newer versions.
In my case, I haven’t explored the scalable because I downloaded the file from a remote server to my machine. I suspect the provider of the data in question would prefer it that way, i.e they didn’t intend for people to utilise the scalable nature of NetCDF. Being appendable or shareable is also not applicable as nothing is writing the data, the script only runs once the data is fully downloaded.
The features that are applicable are:
- Portable - I want to be able to run it on my x86_64 machine.
- Self-describing - this is some what moot as they provide a README document to help explain the fields anyway. However, what is good is the format contains a short name, long name, valid range of values and what unit the attributes is in.
The fact a Python library is available made it easy to start reading data it, the hard bit however was figuring out how the data was structured and what it meant.
Data format - Contents
The following is from the file called MERRA2_400.inst3_3d_aer_Nv.20211231.nc4. This file in question is 3D 3-Hourly Instantaneous for Aerosol Mixing Ratio.
The variables in the file are:
'lon', 'lat', 'lev', 'time', 'AIRDENS', 'BCPHILIC', 'BCPHOBIC', 'DELP', 'DMS',
'DU001', 'DU002', 'DU003', 'DU004', 'DU005', 'LWI', 'MSA', 'OCPHILIC',
'OCPHOBIC', 'PS', 'RH', 'SO2', 'SO4', 'SS001', 'SS002', 'SS003', 'SS004',
'SS005
lon, lat and lev make up the point coordinates. Time is an additional dimension and the remaining variables are the attributes, there is a value for each (lon, lat, lev, time) value.
The following is a useful subset of the information about the ‘lon’ variable and ‘AIRDENS’ respectively.
float64 lon(lon)
    long_name: longitude
    units: degrees_east
unlimited dimensions:
current shape = (576,)

float32 AIRDENS(time, lev, lat, lon)
    long_name: air_density
    units: kg m-3
    _FillValue: 1000000000000000.0
    missing_value: 1000000000000000.0
    fmissing_value: 1000000000000000.0
    scale_factor: 1.0
    add_offset: 0.0
    standard_name: air_density
    vmax: 1000000000000000.0
    vmin: -1000000000000000.0
    valid_range: [-1.e+15  1.e+15]
unlimited dimensions: time
current shape = (8, 72, 361, 576)
filling on
As you can see AIRDENS depends on the time, lev, lat and lon and the shape also makes it clear too.
I discovered that the longitude values have even spacing and likewise for latitude and lev which makes a uniformly sized blocks ideal form to store the information as..
From there the next step is compute the spacing, that is to say the distance between lon values, then distance between lon values and likewise for lev.
The shape of the attributes give us the number of blocks in each direction, however the approach I went for was query the size of each dimension instead. A quick aside, in addition to NetCDF files containing variables it also has the concept of dimensions. Dimensions are used to specify he shape of data in a netCDF file.
At this point, I have enough information that I can produce a visualisation of the data.
Data format - Overall
A single NetCDF file in this case represents a single day, so there is a file provided per-day and within the file the data is for every 3 hours.
The first 3 in inst3_3d signifies that its every 3 hours, the inst refers to instantaneous and the 3D means it was three-dimensional.
Data Visualisation
I applied some filtering to the data, so some of the parts around China are hidden.

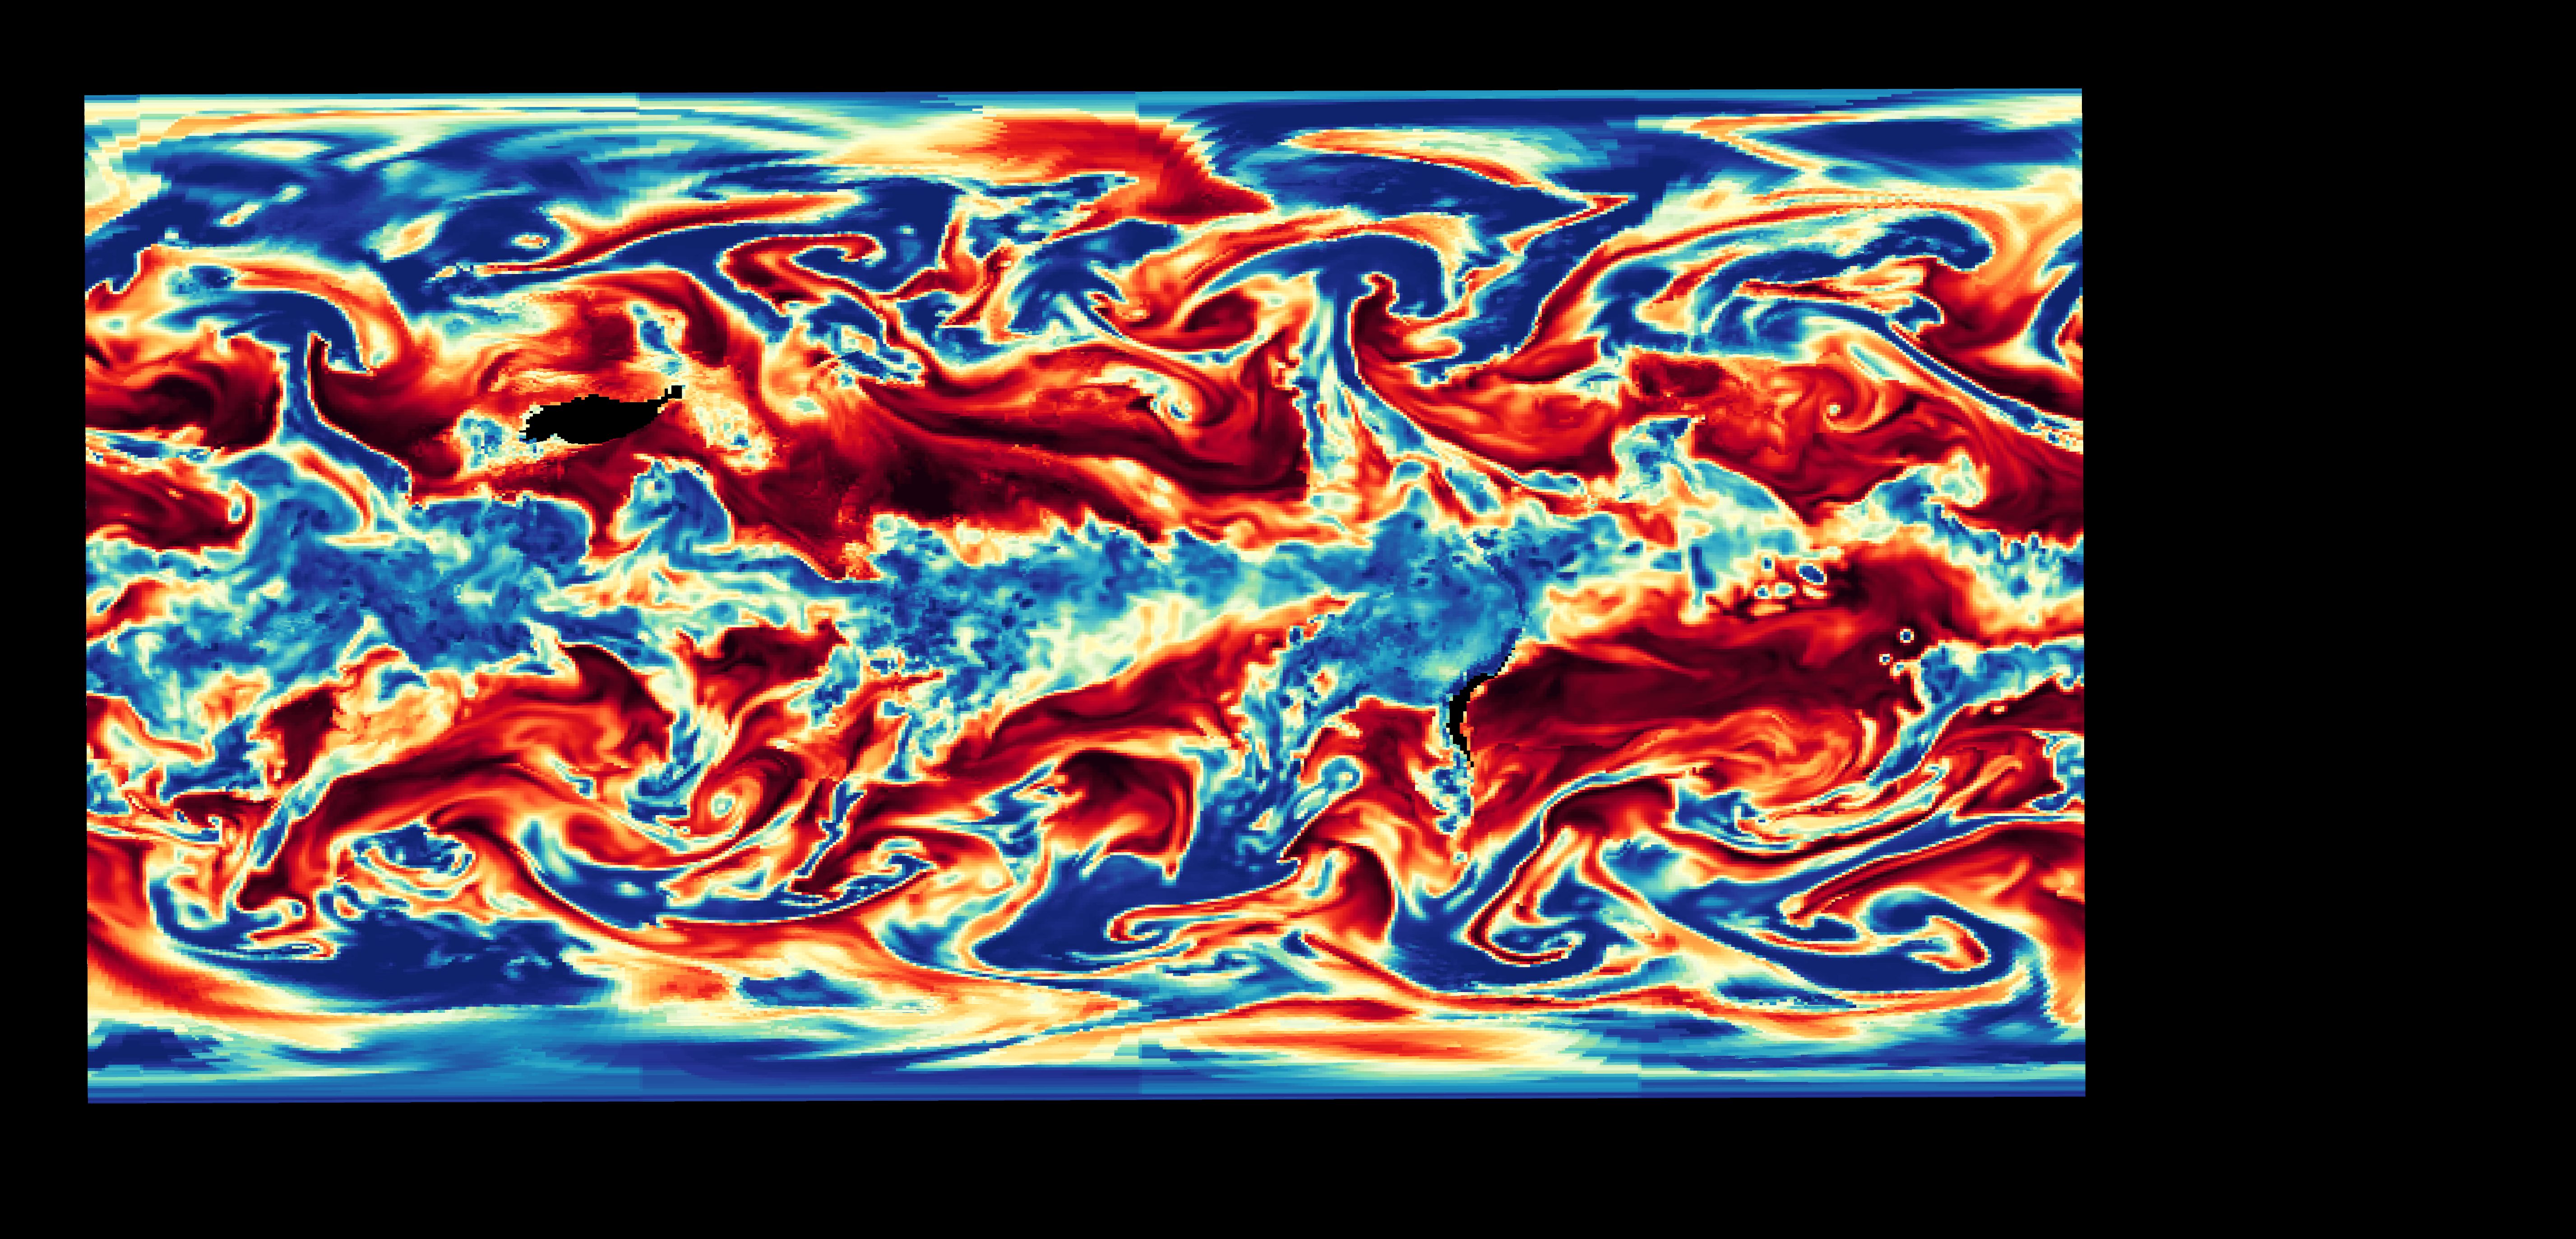
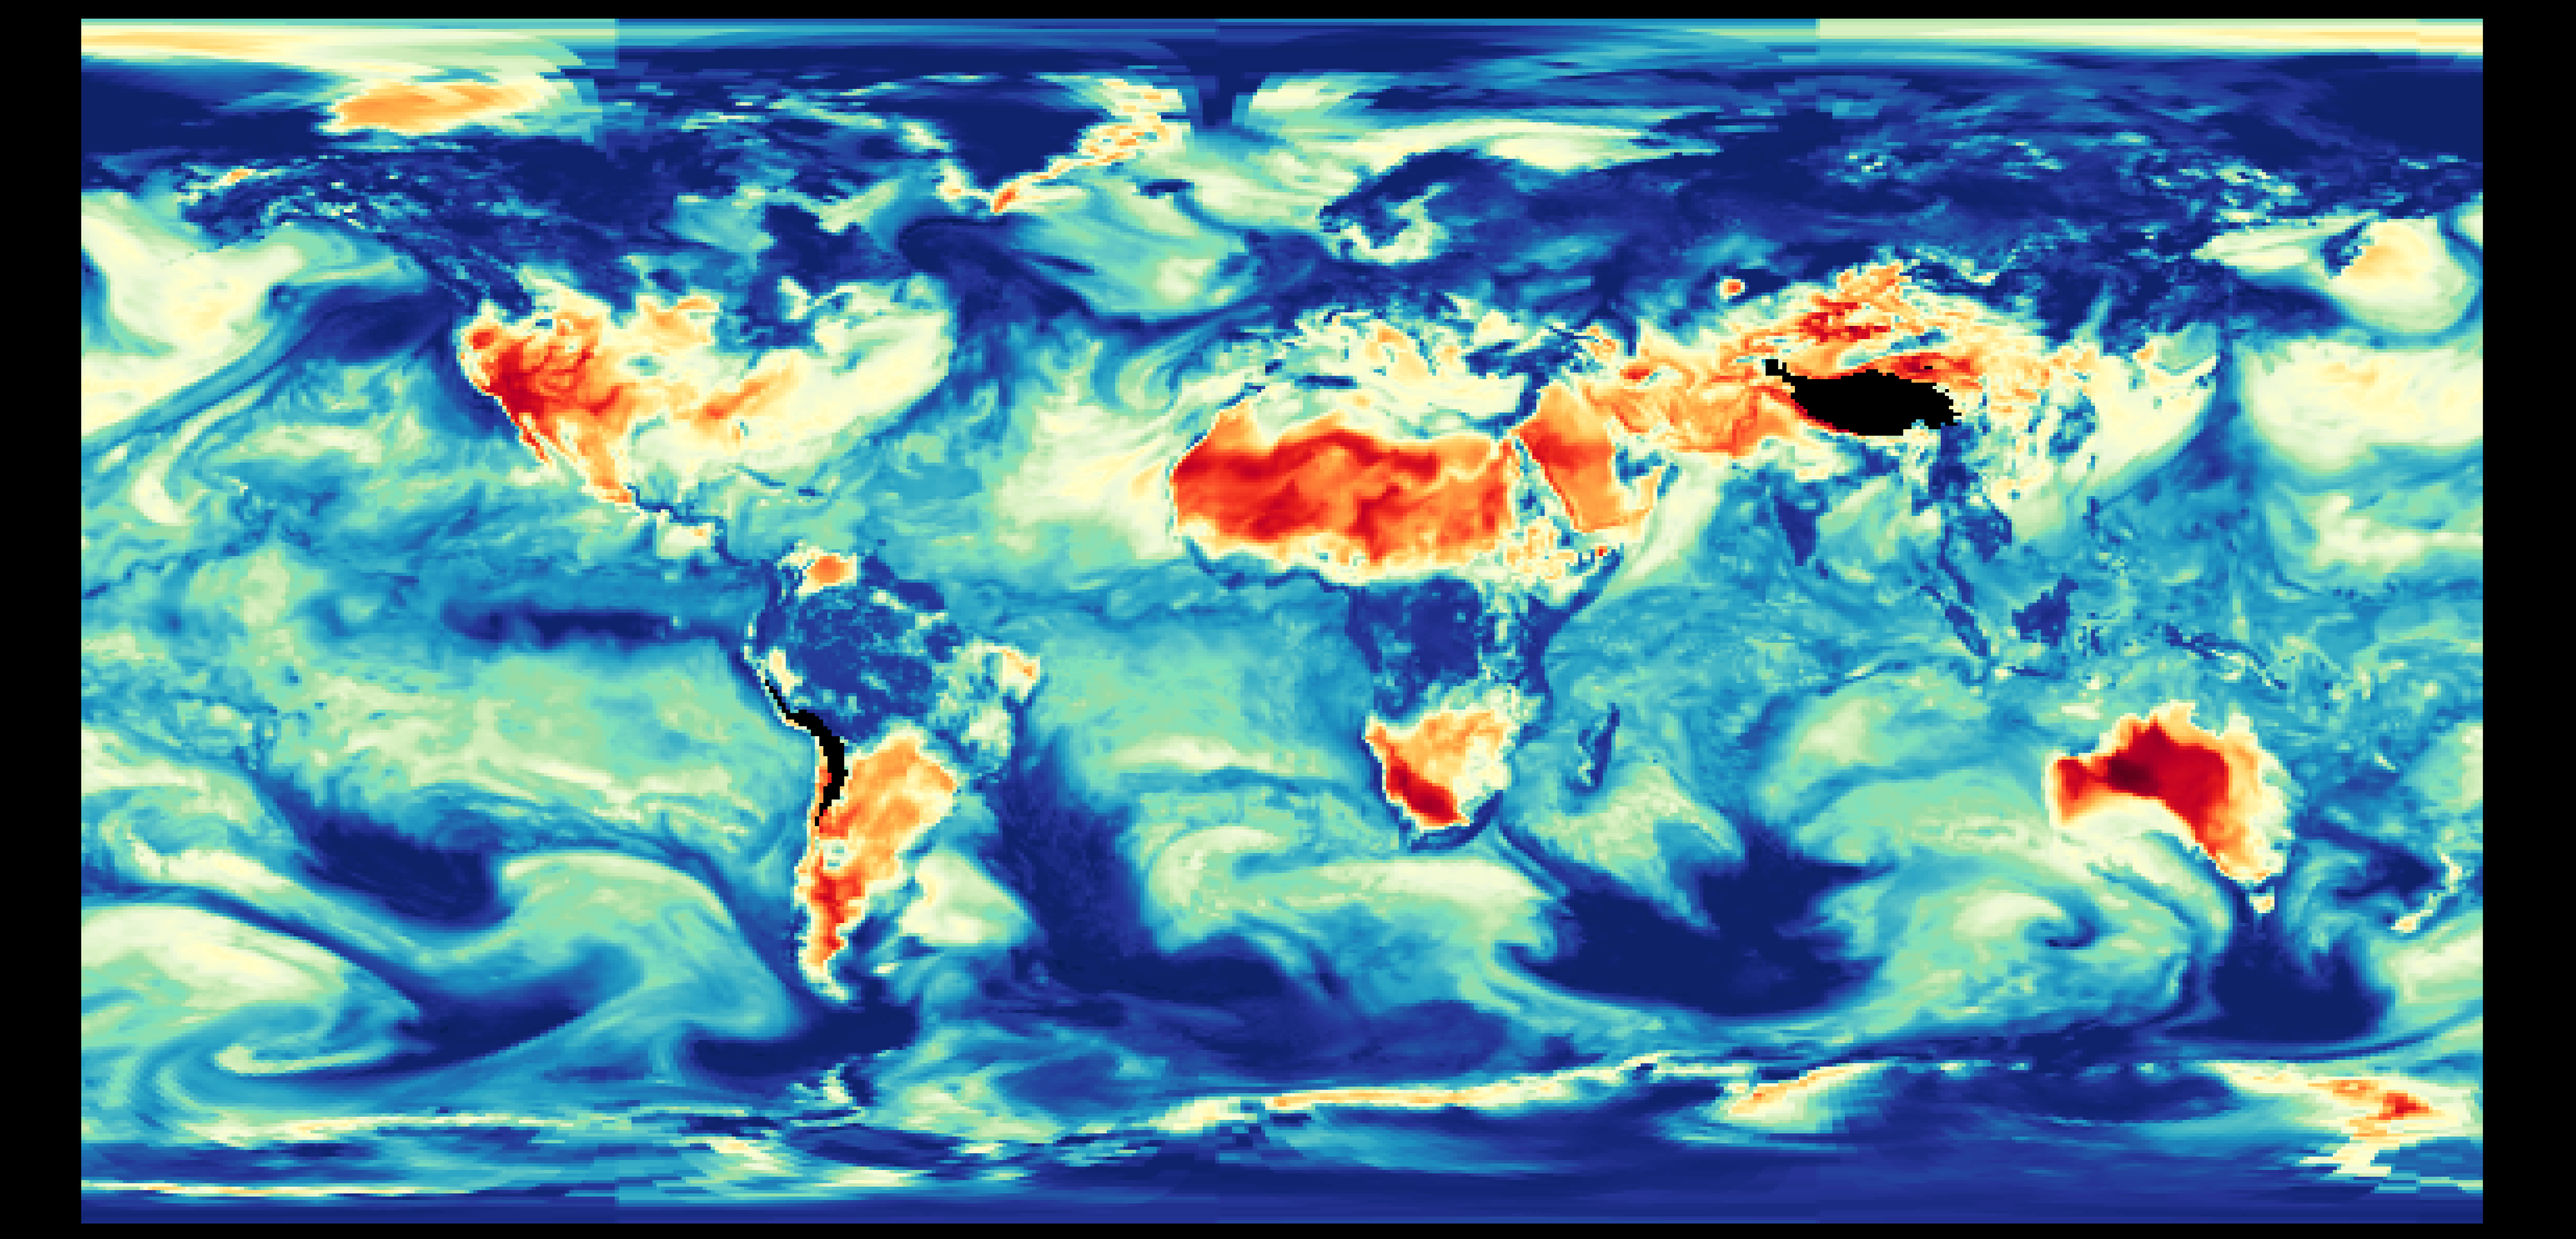
I had hoped to make some of the data translucency however that wasn’t possible
in the software I was using.
7
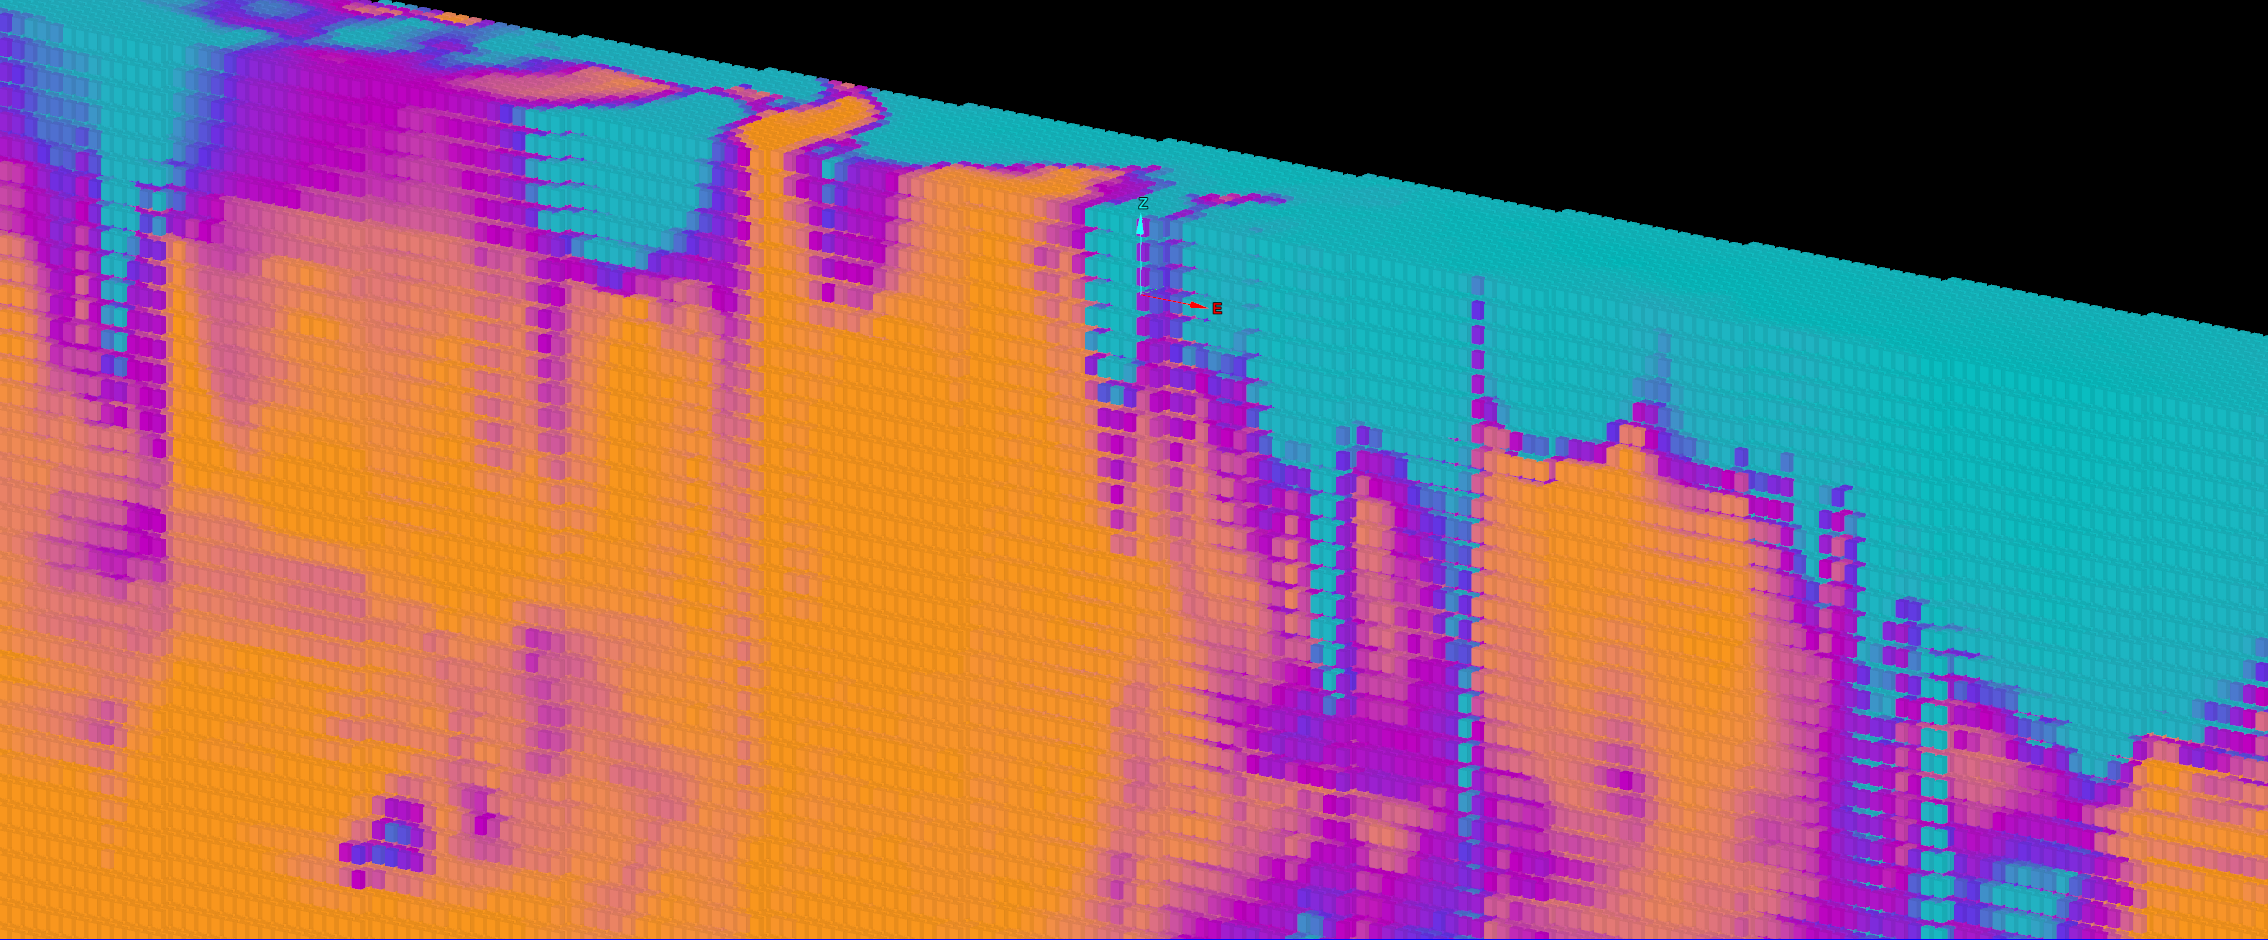
This is a sliced view through the data with a block/cuboid size adjustment made
so they don’t match their real world size. The attribute being shown is the
kg/kg of dimethylsulphide.
Closing
Strictly speaking there is currently nothing that is specific to MERRA-2 data in the import script I wrote. It does however expect ‘lev’ for level rather than an elevation and it requires a time. The former should be possible to handle either and the latter should be possible to make optional.
I had the intention of being able to write a function that could summarise the filename, however didn’t end up doing that. After all, it is possible to read the file and the ‘Title’ or ‘LongName’ from it which would tell you the same thing just in a specific format.
Further Reading
If you interested in learning more about MERRA-2 then the American Meteorological Society (AMS) has a collection of journal articles. They may help answer the question of “What could someone do with this data?”