Visualising PV data from AEMO
AEMO is the Australian Energy Market Operator and are responsible for the National Electricity Market (NEM). They make their data available to increase public understanding and promote transparency.
I set out to write a script that processes the CSV files from NEMWeb and constructs a single Apache Parquet file from them. To date the only data that was tested is the archived rooftop photovoltaic actuals. I’ve then written a script to use matplotlib to plot the data.
I spent a lot of time working on writing out an Apache Parquet file using the
schema derived from the YAML definition. The idea here is, it has the
descriptions of the fields. However after much frustration it fails to capture
date times properly. They end up coming out as dates. Prior to upgrading from
pyarrow-2.0.0 to 6.0.1 it would always say
pyarrow.lib.ArrowInvalid: Timestamp value had non-zero intraday milliseconds
when creating the pyarrow array, which as I typed this up I think it might
really mean the same as non-zero seconds between days. Something to consider
next time I look at that.
The data showing generation every half-hour ends oscillates each day by hitting zero when the sun goes down so there is always a low point towards the end of the solar day.
That is where my brother showed me an example of how this data is typically plotted where you only consider a ‘day view’ and plot each day generation as a different series. Additionally, it also divides it by season. After all you expect in winter, generation from solar collection will be reduced and sure enough that can be seen in the diagram.
After getting this set-up, I was really interested in being able to show the fuel source contribution however I was unable to find the data sources needed for that. It would seem there is two data sets needed, one which is the generation of each station and then the type of fuel that each station uses.
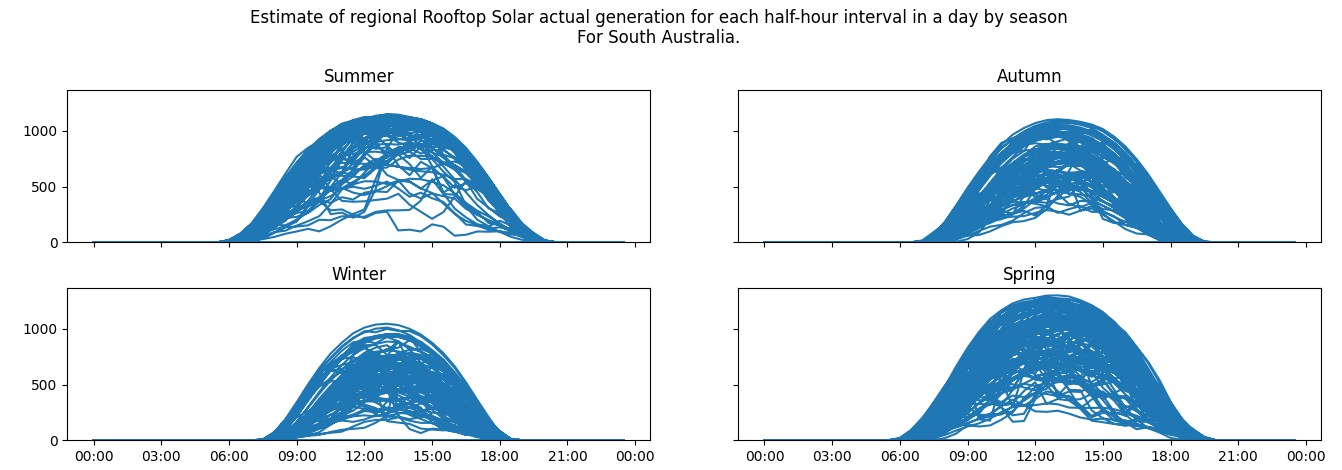
Actual generation by season for South Australia
The following graph shows the estimate for actual generation (as opposed to assumed generation), for the Australia state of South Australia. There is a graph that represents each season. As expected summer has a wider window of generation than winter given there is more light in the days.
As you seen around midnight there is no solar generation estimated.
The following shows the estimate for the actual generation for each half-hour interval excluding night time for each state broken down by state. I’ve filtered out before 5:30am and after 9:00pm. Otherwise you simply end up with no bars 8 hours each day.
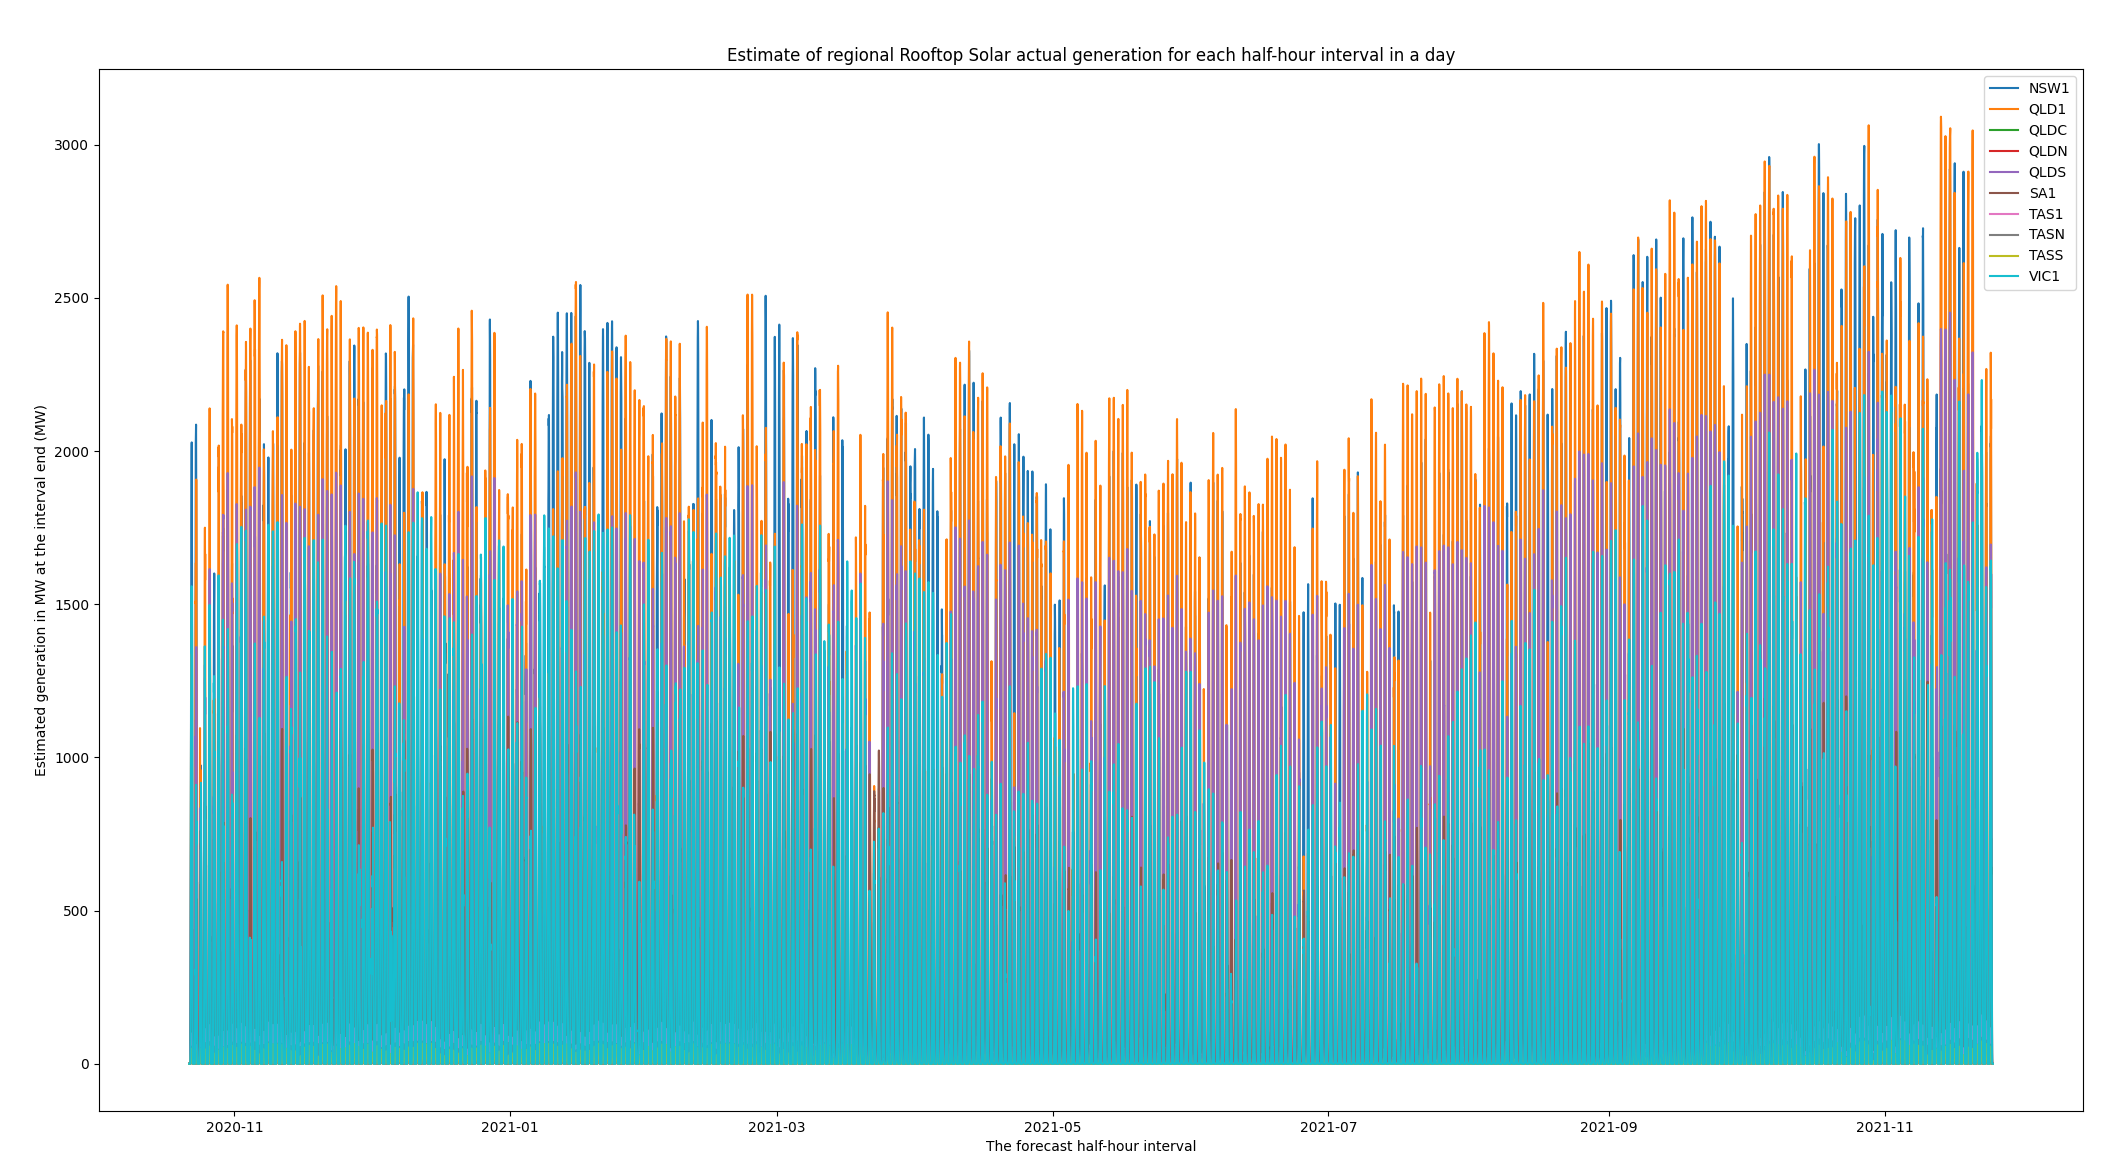
Apologies for not limiting the Y-axis properly to eliminate the space between Y = 0 and the bottom of the chart and X-axis labels.